The Tongass National Forest has a new online tool for subsistence users in Southeast Alaska. They call it the Subsistence Dashboard. Right now it includes data on sockeye fisheries monitoring as well as wildlife regulatory changes and boundaries. There are live maps to help harvesters better navigate current regulations.
Robert Cross is the subsistence program manager for the Tongass National Forest. He talked with CoastAlaska’s Angela Denning about the new online dashboard, which he says was created by popular demand.
Cross: It was developed in response to some feedback that we’ve gotten from tribal organizations and subsistence users just all across Southeast Alaska, basically just related to the desire for better access to data and regulatory maps.
CoastAlaska: Can you give an example of how, like a subsistence user, would use the dashboard?
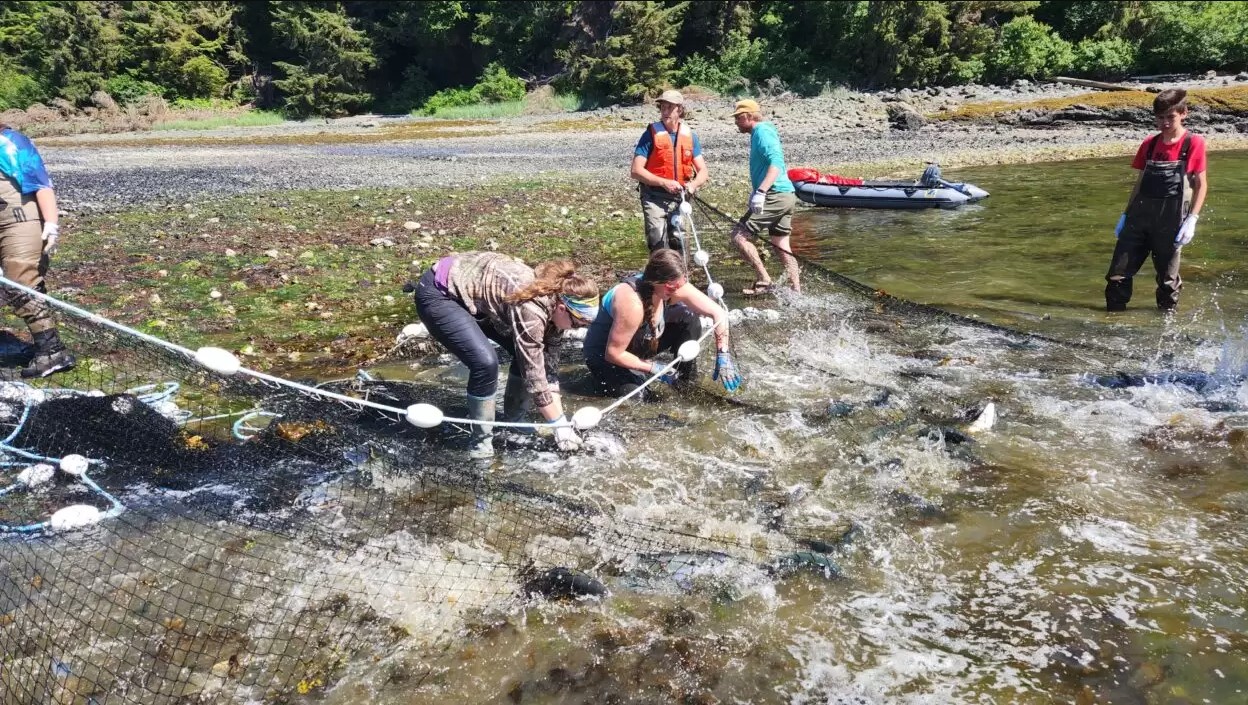
Cross: Yeah. So one good example, I think, would be like the Redoubt Lake project. That’s one of our pilot projects, where we actually provide daily updates of the sockeye escapement, and so somebody in Sitka can look at those daily updates and sort of make decisions about economy of effort and fuel to travel all the way out to read out Lake and decide whether or not that’s worth their time. So you know, nobody wants to go fish somewhere. If there’s no fish in the river, and we happen to have a weir there, and we have that information, and can provide that to the public to be able to make those decisions about, you know, if it’s worth taking the day off and spending gas money to get out there to go fishing,
CoastAlaska: When I did look at the dashboard, there was the map of sockeye fishing, and it looked like there were over a dozen sites where people are known to subsistence fish.
Cross: Yeah, and there’s a lot more than that. It’s — the interactive map that we have on the sockeye page of the dashboard shows all of our current and past fisheries resource monitoring program sites, so places where the Forest Service has funded sockeye weir so the ones that you can see on the interactive map, those are the sites where we’ve had weirs, or we currently have weirs, and so now, with this dashboard, we can provide the current and historic escapement and harvest information to folks. And all of this is already information that exists, it’s just sort of dispersed amongst publications and written reports and things like that. So we’re –really one of the reasons for this dashboard is to consolidate all that information and make it a lot more accessible to people, to be able to make those decisions, but also be able to check on a sockeye site that’s really important to them and see what the health of the run is this year compared to, you know, 5,10, 15, 20, years ago.
CoastAlaska: I also noticed there were deer and moose on the dashboard. How might that help hunters?
Cross: Yeah, so there’s a couple pages — so there’s three different pages that are associated with wildlife. We have the special actions page for mountain goat and moose. We also have the deer harvest page, which is a visual representation on a live map that shows the game management unit two, or the Prince of Wales area shows all the different regulations based on land ownership and rural determination and things like that. And then we also have a set of offline maps that work with the Avenza app. And so harvesters can go online and download a map onto their phone, and then they can see where they’re at, when they’re in the woods offline, they can see where they’re at, in reference to regulatory boundary markers. And so an example of how that will be helpful is that the in-season management page shows any current in season management actions that are currently out for moose or mountain goats. So, like Unit Four Baranof Island goats would be a really good example. It’s split up into all these different goat harvest zones based on watersheds, and then those zones have individual quotas for the number of males or females that can be harvested within that zone. And when the quota is met, then that zone gets closed through an in-season management action. And so with this dashboard, harvesters can go online, they can see which zones are open, which ones are closed, and they can even see how much of the quota is remaining in that zone. So if you’re planning on going and hunting the Lucky Chance zone and with two people and there’s only one Billy left on the quota, then you might use that information to decide to go to a different hunting zone.
CoastAlaska: Well, thank you so much for explaining the subsistence dashboard. Is there anything that you wanted to add?
Cross: We’re really excited about it. We’re also open to developing new aspects of the dashboard. So this is our first release of it, but if there’s information that other folks would like to see put onto this dashboard, then that’s something that they can reach out to myself or my staff about and we’re happy to try to incorporate that into this.
The Subsistence Dashboard website.
Robert Cross can be reached at the email: robert.cross@usda.gov.


